| View previous topic :: View next topic |
| Author |
Message |
wayden
Cheater
![]() Reputation: 0 Reputation: 0
Joined: 09 Dec 2020
Posts: 27
|
 Posted: Sun Jul 09, 2023 2:12 am Post subject: Code Filter Crashes Game Posted: Sun Jul 09, 2023 2:12 am Post subject: Code Filter Crashes Game |
 |
|
Hi,
Im trying to use Code Filter in Hell is others, and it apparently crashes, i already search and found two topics (can't post url's yet)
But i don't really understand what i should do,
i generated the list using Unwind info and then gameassembly.dll
then start into crash
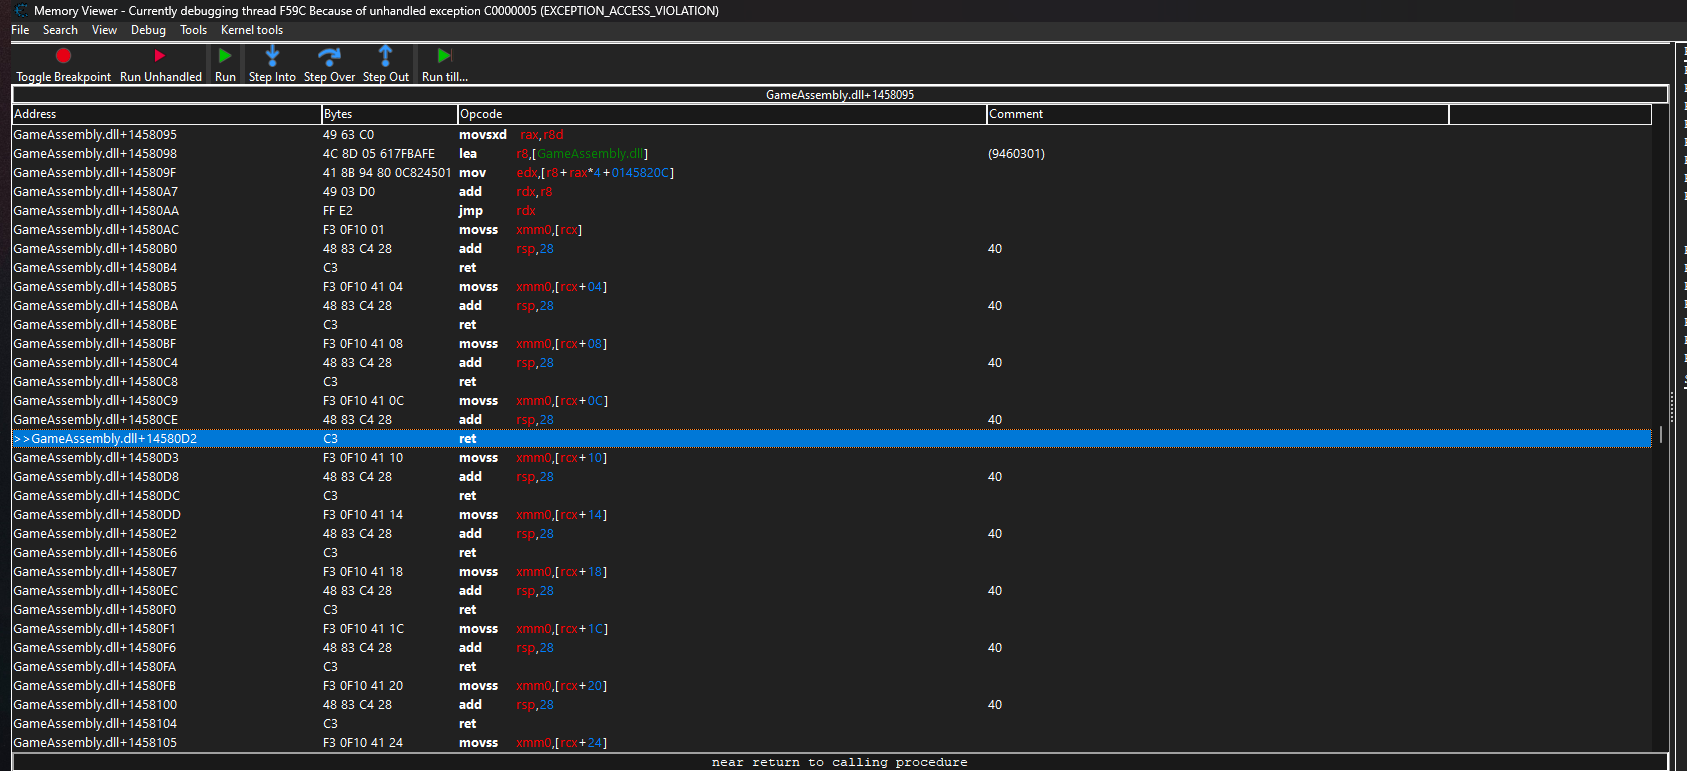
so i read the post telling that i have to set the debugger option to break on unexpected breakpoints
then i set it on break and restart and it just got stuck on this with ERROR ACCES VIOLATION
error.png
Then come the moment i have to | Quote: | "You need to go through every address in the list and verify it is in fact a call and not the inside of an instruction
Using the break on unexpected breakpoint you have a decent method to figure out which addresses are wrong and then delete them" - DarkBytes Thu Oct 17, 2019 |
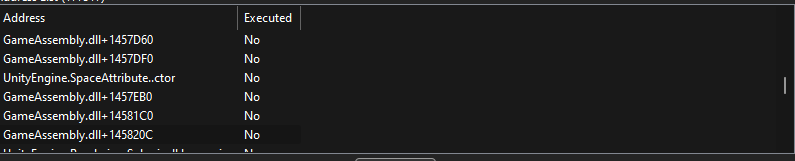
and i can't figure what it means, i have like 170k adress in the list prob not gona go throught every single one of them and i don't understand what am i searching ? do i search a call to the part of code that cause the unexpected error ? should i first filter the already executed adresses then verify each one of them ?
i already removed the addresses in the screen from the list but it then stop on the next ret and the adresse isn't anymore on the list and can't be removed
here is what im left with : error2.png
i don't really know what i can do and how to do it
EDIT: even when the list is cleared it keeps being stuck on those same instruction i guess it just can't go pass throught those errors and keeps breaking so is there anyway for the debug to ignore those instruction if there is unexpected error and continue processing the other?
| Description: |
|
| Filesize: |
8.53 KB |
| Viewed: |
3375 Time(s) |
|
| Description: |
|
| Filesize: |
87.69 KB |
| Viewed: |
3376 Time(s) |
|
Last edited by wayden on Sun Jul 09, 2023 9:02 am; edited 1 time in total |
|
| Back to top |
|
 |
Dark Byte
Site Admin
 Reputation: 472 Reputation: 472
Joined: 09 May 2003
Posts: 25869
Location: The netherlands
|
| Posted: Sun Jul 09, 2023 8:18 am Post subject: |
|
|
make sure you use CE7.5 or later with unwind info
_________________
Do not ask me about online cheats. I don't know any and wont help finding them.
Like my help? Join me on Patreon so i can keep helping |
|
| Back to top |
|
|
wayden
Cheater
![]() Reputation: 0 Reputation: 0
Joined: 09 Dec 2020
Posts: 27
|
| Posted: Sun Jul 09, 2023 8:44 am Post subject: |
|
|
i am using 7.5 yep :/ im gonna try to reinstall just in case
Reinstaling didn't change anything
|
|
| Back to top |
|
|
Dark Byte
Site Admin
Reputation: 472
Joined: 09 May 2003
Posts: 25869
Location: The netherlands
|
| Posted: Sun Jul 09, 2023 9:02 am Post subject: |
|
|
Did you use multiple CE's or close CE ?
because those breakpoints aren't marked as breakpoints that CE handles
try the normal windows debugger or veh, not dbvm or kernel
are those int3's at that point before you start the code filter?
_________________
Do not ask me about online cheats. I don't know any and wont help finding them.
Like my help? Join me on Patreon so i can keep helping |
|
| Back to top |
|
|
wayden
Cheater
![]() Reputation: 0 Reputation: 0
Joined: 09 Dec 2020
Posts: 27
|
| Posted: Sun Jul 09, 2023 9:16 am Post subject: |
|
|
i have multiple CE instalation yeah one that is "undetectable"
but i had only the official CE running with clean instalation,
i tried every debugger except dbvm and kernel because of
"the drivers are marked as vunerable by windows" message or something like that, so i didn't tried.
The unstopable break chain happens when using windows debugger
and veh just crashes the game even with the break(wich doesn't break on anything btw) option activated so yeah im kinda lost on that one, could it be an anti debugger or something like that ?
|
|
| Back to top |
|
|
|

